Coding projects
Toy sand simulator in Python
Written for / inspired by Day #14 of Advent of Code 2022. Full code can be found on GitHub. The main simulator function uses custom classes Map and Sand to track the trajectory and location of each particle. You can also change the dimensions of the map and choose whether or not to include a platform.
	def simulate():
		my_map = Map(dims=[10, 21], floor=True, platform=False)
		my_map.show_map()
		while True:
			# create new piece of sand
			sand = Sand(my_map)
			while (not sand.in_void()) and (not sand.is_settled()):
				sleep(0.01)
				if sand.free_below():
					sand.move('down')
				elif sand.free_left():
					sand.move('left-diag')
				elif sand.free_right():
					sand.move('right-diag')
				my_map.frame_counter += 1
				my_map.show_map()
			if sand.in_void():
				return sand.map.count_sand()
See the simulator in action (with a platform!):
U.S. air pollution map in R
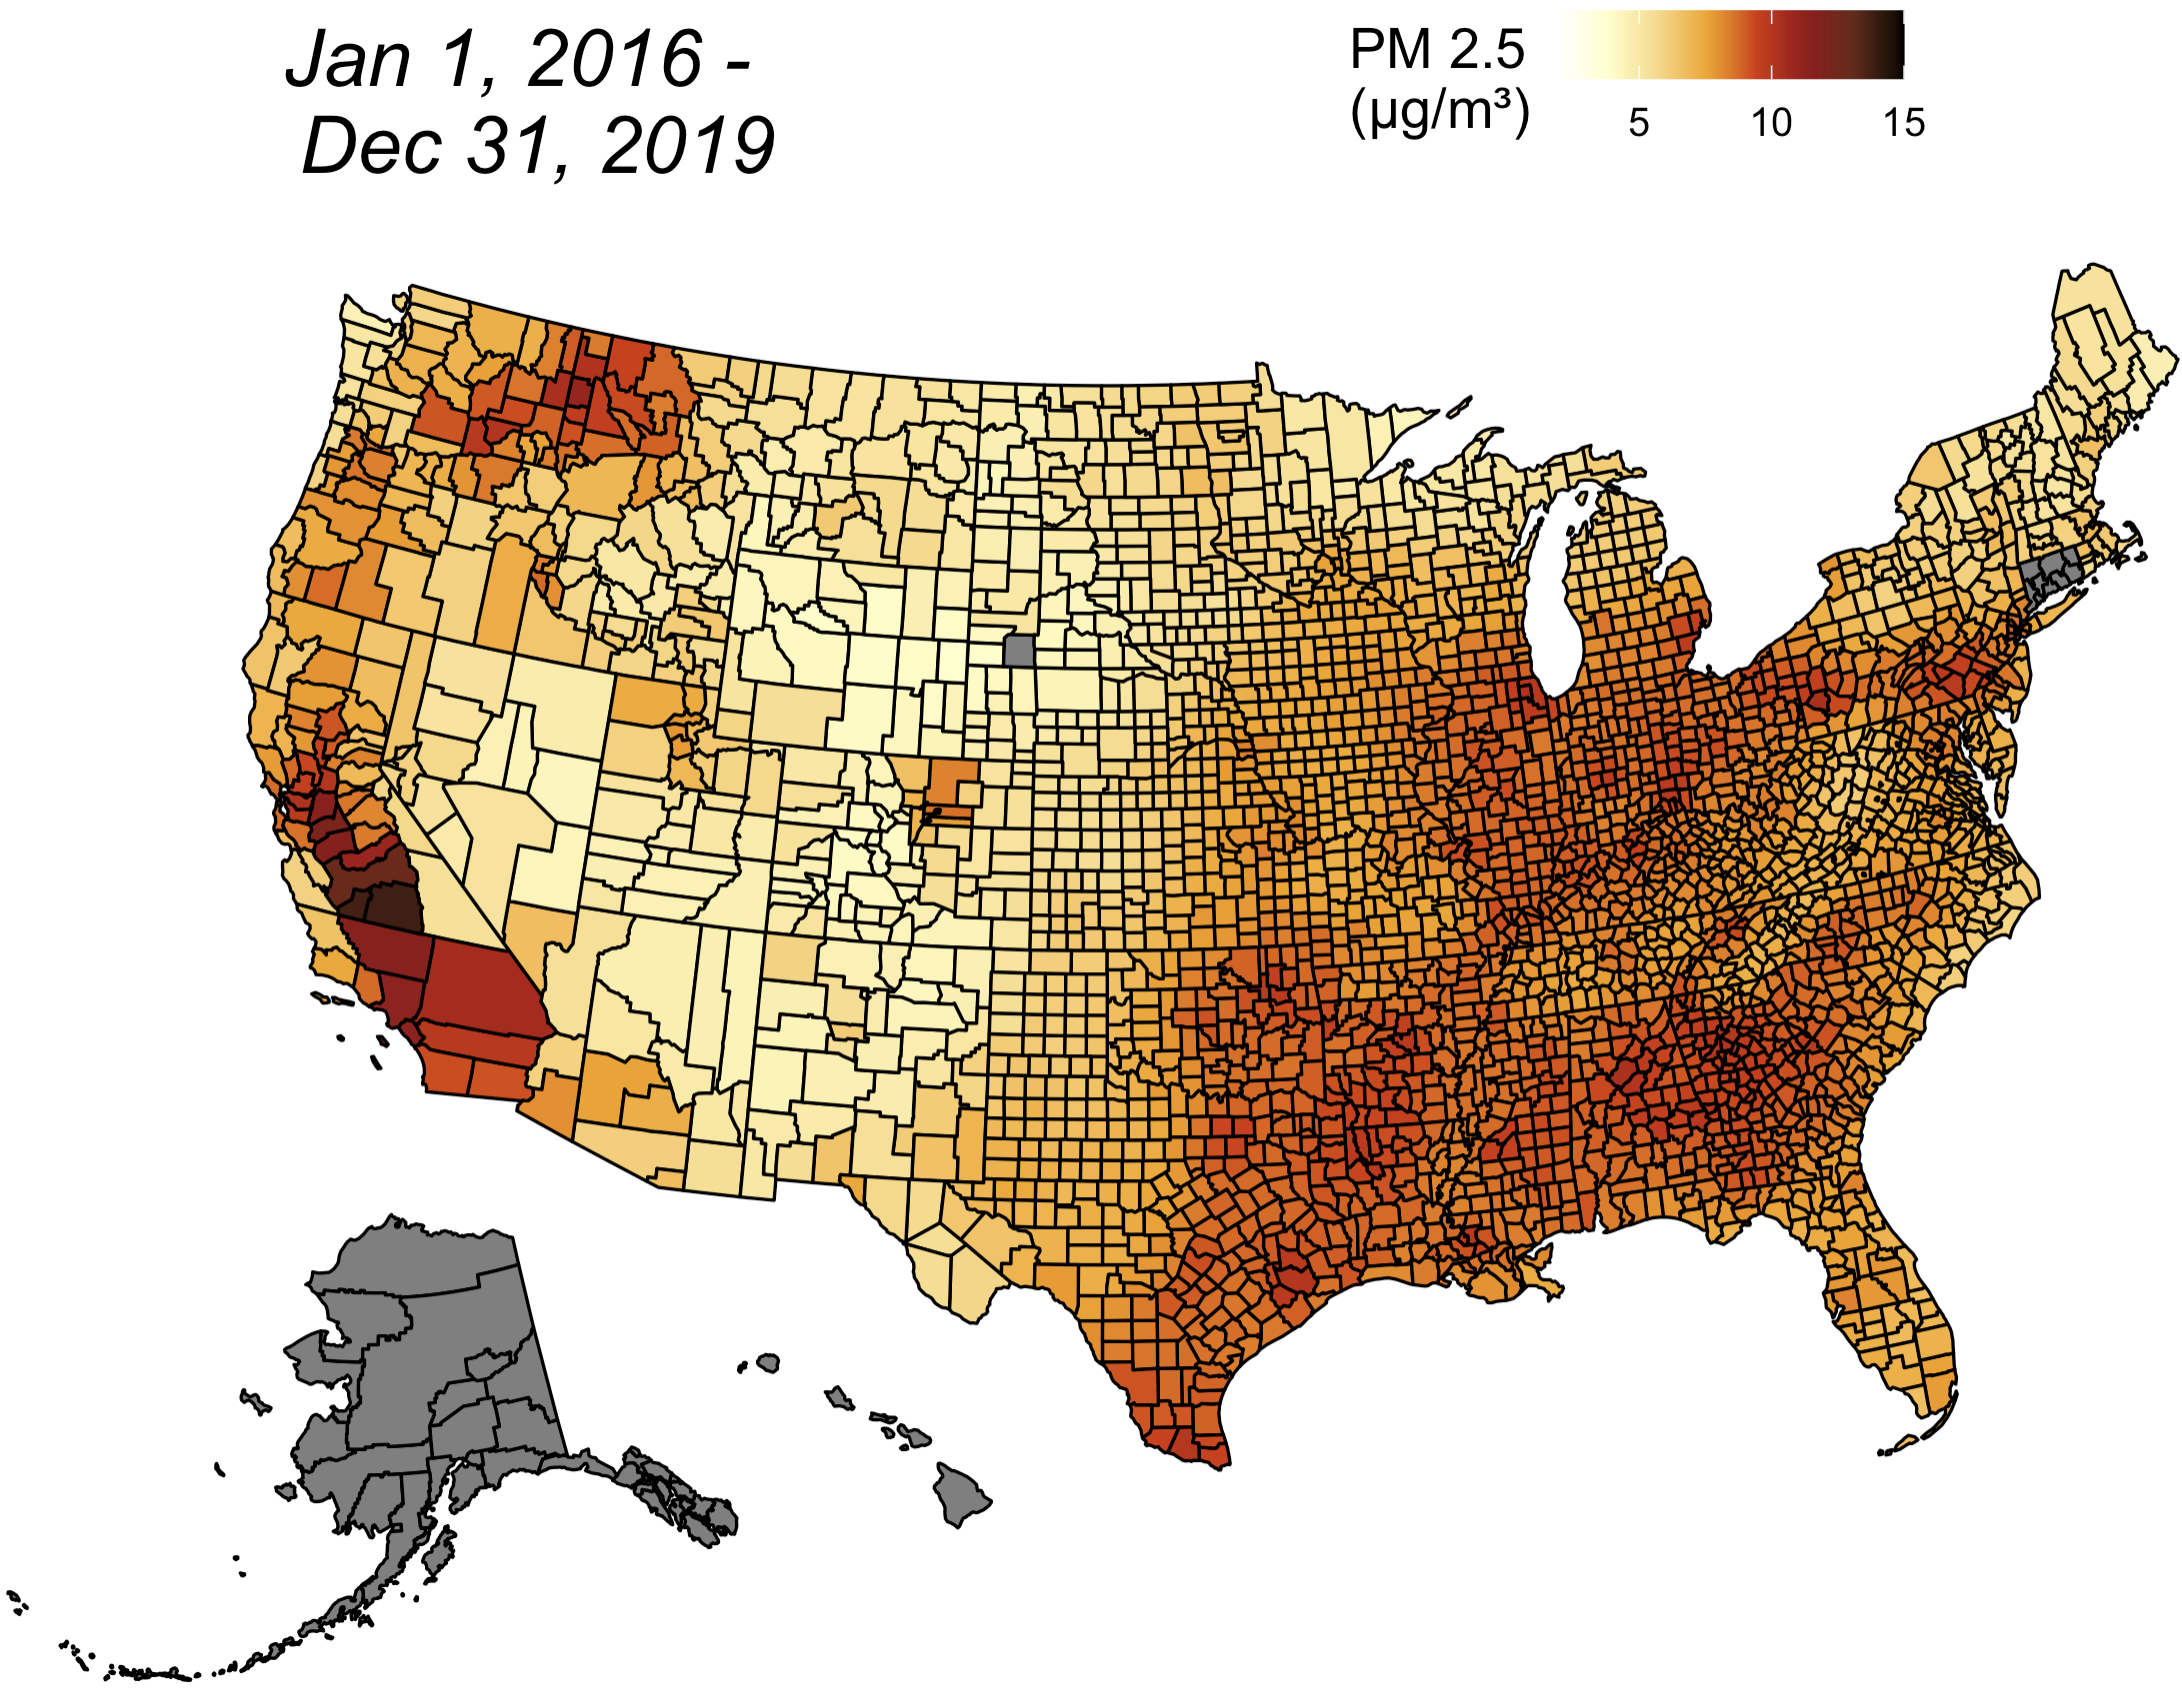
Air pollution, particularly fine particulate matter (PM 2.5), is likely to have negative impacts on cardiovascular health (Basith et al., 2022). PM 2.5 data at the county level are made publicly available by the CDC and are based on model predictions from the EPA's Downscaler model. Citation: Centers for Disease Control and Prevention. National Environmental Public Health Tracking Network. Web. Accessed: Feb 23, 2024. www.cdc.gov/ephtracking.
Below is a plot of the mean predicted PM 2.5 concentrations for each available county in the United States from 2016-2019.

And here's an animation of PM 2.5 concentrations by month (2016-2019):
Code section for how to create each frame of the animation (the whole script is available on GitHub):
	create_frame <- function(start, end, month=FALSE) {

	  year <- substr(start, 1, 4)
	  if (month == TRUE){
	    mo <- date_to_str(substr(start, 5, 6))
	  } else {
	    mo <- ''
	  }

	  air_pollution_timeline <- subset(air_pollution_df, start <= numeric_date
		  & numeric_date < end)
	  air_pollution_reduced <- select(air_pollution_timeline, c('fips', 'values'))
	  average_pm25 <- aggregate(values ~ fips, air_pollution_reduced, mean)

	  plot_usmap(regions = "counties", data = average_pm25) +
	    scale_fill_gradientn(limits = range(0, 45), colours = palette) +
	    labs(title = paste(mo, year), fill = "PM 2.5\n(\u00b5g/m\u00b3)") +
	    theme(panel.background=element_blank(),
	          legend.position = c(0.7, 1.0),
	          legend.direction = "horizontal",
	          legend.text = element_text(size=14),
	          legend.title = element_text(size=20),
	          plot.title = element_text(size=48,face="italic", hjust=0.2))
	}
2D spaceship game in Java
Below is a video of gameplay for a 2D game I created in Java. For the individual sprites, the game makes use of a basic Character class, along with Player, Enemy, and Bomber classes that inherit many of the Character methods and attributes in order to create unique behavior. The Player class in particular accepts user input in order to move the sprite and fire (as well as starting the game).
The explosion, enemy, bomber (and bombs), and player sprites are based on images generated using Craiyon LLC's AI art generator model on craiyon.com. Laser sprites are made by me!
Below is the class method for checking whether a sprite has been hit by enemy gunfire, used by all classes that inherit from the Character class. Code for the other classes is available on GitHub.
	public boolean inHitbox() {

	    // Check if character is within bounding box of enemy gunfire
	    for (Gunfire f : disp.fireballs) {
		if ((f.owner.getClass() == Enemy.class &
			this.getClass() == Enemy.class) |
		    (f.owner.getClass() == Bomber.class &
			this.getClass() == Enemy.class) |
		    (f.owner.getClass() == Enemy.class &
			this.getClass() == Bomber.class) |
		    (f.owner.getClass() == Bomber.class &
			this.getClass() == Bomber.class)) {
			continue;
		}
		if (f.pos_x - (disp.tileSize / 4) < pos_x &
		    pos_x < f.pos_x + (disp.tileSize / 4) &
		    f.pos_y - (disp.tileSize / 4) < pos_y &
		    pos_y < f.pos_y + (disp.tileSize / 4)) {
			f.moveCorpse();
			f.velocity = 0;
			return true;
		}
	    }
	    return false;
	}
